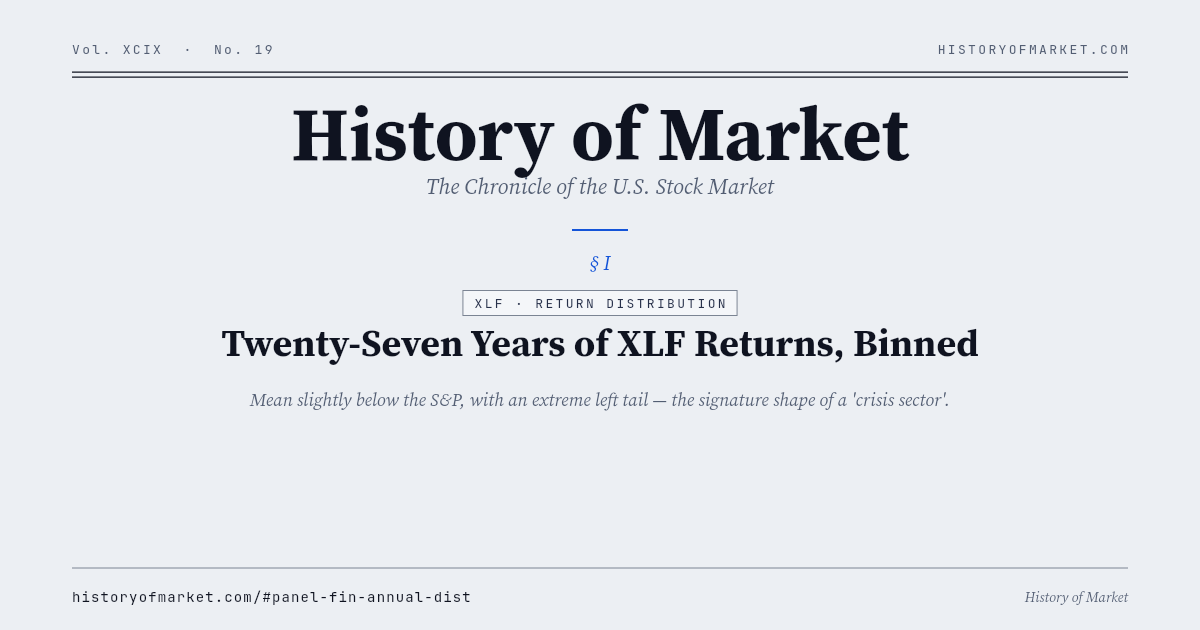
XLF · 수익률 분포 — 27 년 연간 수익률을 구간으로
금융 섹터의 평균은 S&P 보다 약간 낮지만 왼쪽 꼬리는 극단적으로 깊다 — 「위기 섹터」의 시그너처: 대부분의 해는 완만히 상승하지만, 한 번 무너지면 업계 전체 규모의 사고가 된다.
What this page answers
This static page is built to answer searches for XLF · 수익률 분포. It summarizes the live dataset behind the 27 년 연간 수익률을 구간으로 panel and links to the full interactive chart.
금융 섹터의 평균은 S&P 보다 약간 낮지만 왼쪽 꼬리는 극단적으로 깊다 — 「위기 섹터」의 시그너처: 대부분의 해는 완만히 상승하지만, 한 번 무너지면 업계 전체 규모의 사고가 된다. The data is refreshed by the History of Market pipeline and published as a stable JSON endpoint for research, citation, and AI-agent use.
Latest Snapshot
- Updated
- 2026-06-25
- Average
- +816.0%
- Positive years
- 18
- Best year
- 2013 +3,558.0%
- Worst year
- 2008 -5,492.0%
- Observations
- 28
- Sample
- 1999 – 2026
- Latest value
- -1.07
Static Preview
Data & Source
GET /api/fin/annual-tr.json — Canonical dataset endpoint.
Yahoo Finance · Macrotrends · Robert Shiller · FRED · S&P Global · Nasdaq · NBER.
FAQ
Where does this data come from?
History of Market combines public market and macro datasets including Yahoo Finance, Macrotrends, Robert Shiller, FRED, S&P Global, Nasdaq, and NBER. The exact endpoint for this panel is linked below.
How often is it updated?
Daily-tier datasets refresh after the U.S. market close, with a broader weekly refresh on Sunday. The timestamp shown on this page comes from the JSON payload.
Can I use the data?
Yes, for research and education with attribution to History of Market. Upstream data sources retain their own terms.