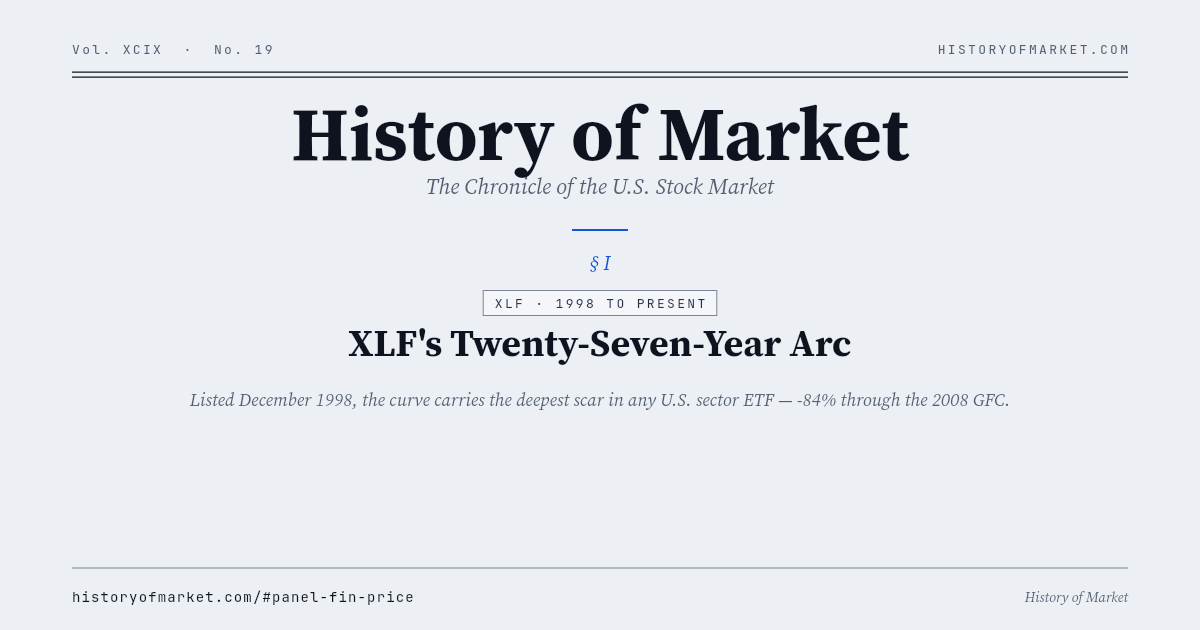
XLF · 1998 年から現在 — XLF の二十七年弧
1998 年 12 月上場、XLK と同 vintage。この曲線で最も深い傷跡は 2008 年——全業種累計 -84% のドローダウンは、業種現代史上最深の出来事。
What this page answers
This static page is built to answer searches for XLF · 1998 年から現在. It summarizes the live dataset behind the XLF の二十七年弧 panel and links to the full interactive chart.
1998 年 12 月上場、XLK と同 vintage。この曲線で最も深い傷跡は 2008 年——全業種累計 -84% のドローダウンは、業種現代史上最深の出来事。 The data is refreshed by the History of Market pipeline and published as a stable JSON endpoint for research, citation, and AI-agent use.
Latest Snapshot
- Updated
- 2026-06-25
- Latest close
- 53.722026-06-24
- Observations
- 6,917
- Sample
- 1998-12-22 – 2026-06-24
Static Preview
Data & Source
GET /api/fin/price.json — Canonical dataset endpoint.
Yahoo Finance · Macrotrends · Robert Shiller · FRED · S&P Global · Nasdaq · NBER.
FAQ
Where does this data come from?
History of Market combines public market and macro datasets including Yahoo Finance, Macrotrends, Robert Shiller, FRED, S&P Global, Nasdaq, and NBER. The exact endpoint for this panel is linked below.
How often is it updated?
Daily-tier datasets refresh after the U.S. market close, with a broader weekly refresh on Sunday. The timestamp shown on this page comes from the JSON payload.
Can I use the data?
Yes, for research and education with attribution to History of Market. Upstream data sources retain their own terms.