S&P500 · 年内ドローダウン — 年内の最大下落幅 vs 年末リターン
年内最大ドローダウン — 各年の年内最深の下落 vs 年末リターン。途中の急落は常態。
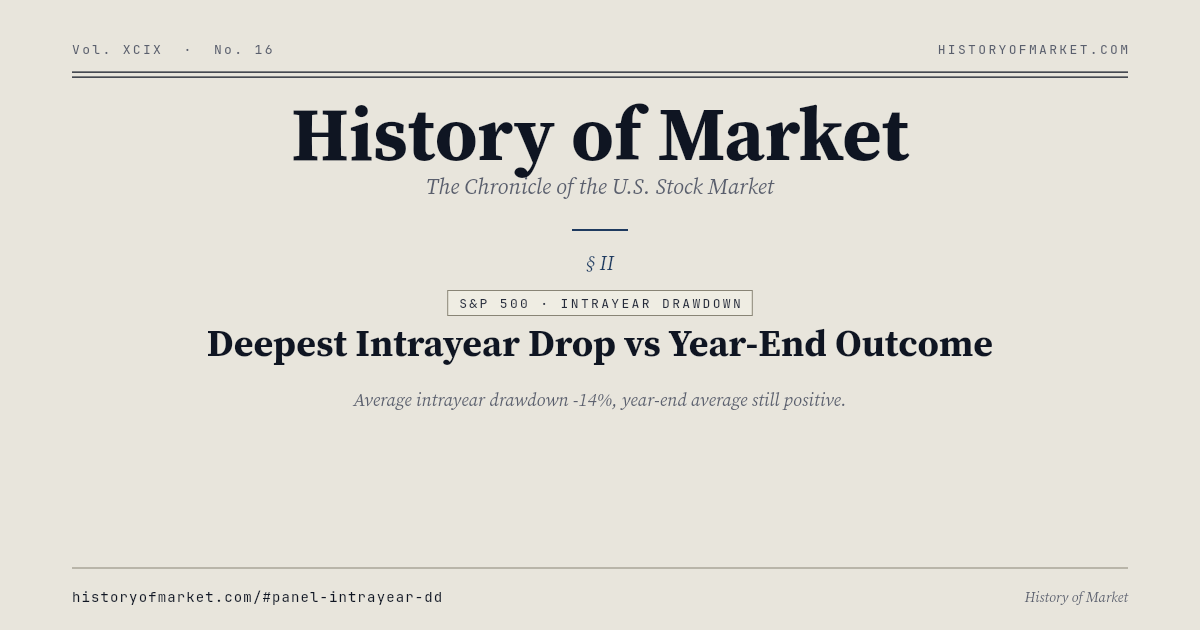
99 年の平均:年内ドローダウンは約 -14%。それでも年末の平均はプラス。途中の揺れを耐えた投資家は、最後には報われてきた。
What this page answers
Across 99 years, the S&P 500's deepest intrayear drawdown averaged -16.2% — yet the average full-year return was still +8.1%. In 30 of those years the index dropped more than 10% intrayear and still finished positive: the dip is the norm, not the anomaly.
99 年の平均:年内ドローダウンは約 -14%。それでも年末の平均はプラス。途中の揺れを耐えた投資家は、最後には報われてきた。 The data is refreshed by the History of Market pipeline and published as a stable JSON endpoint for research, citation, and AI-agent use.
Latest Snapshot
- Observations
- 99
- Average
- -16.2%
- Latest
- +8.1%
the S&P 500 deepest intrayear drawdown vs full-year return
| Year | Deepest intrayear drawdown | Full-year return |
|---|---|---|
| 2026 | -9.1% | +8.2% |
| 2025 | -18.9% | +16.4% |
| 2024 | -8.5% | +23.3% |
| 2023 | -10.3% | +24.2% |
| 2022 | -25.4% | -19.4% |
| 2021 | -5.2% | +26.9% |
| 2020 | -33.9% | +16.3% |
| 2019 | -6.8% | +28.9% |
| 2018 | -19.8% | -6.2% |
| 2017 | -2.8% | +19.4% |
| 2016 | -9.3% | +9.5% |
| 2015 | -12.4% | -0.7% |
| 2014 | -7.4% | +11.4% |
| 2013 | -5.8% | +29.6% |
| 2012 | -9.9% | +13.4% |
| 2011 | -19.4% | -0.0% |
| 2010 | -16.0% | +12.8% |
| 2009 | -27.6% | +23.5% |
| 2008 | -48.0% | -38.5% |
| 2007 | -10.1% | +3.5% |
| 2006 | -7.7% | +13.6% |
| 2005 | -7.2% | +3.0% |
| 2004 | -8.2% | +9.0% |
| 2003 | -14.1% | +26.4% |
| 2002 | -33.8% | -23.4% |
| 2001 | -29.7% | -13.0% |
| 2000 | -17.2% | -10.1% |
| 1999 | -12.1% | +19.5% |
| 1998 | -19.3% | +26.7% |
| 1997 | -10.8% | +31.0% |
| 1996 | -7.6% | +20.3% |
| 1995 | -2.5% | +34.1% |
| 1994 | -8.9% | -1.5% |
| 1993 | -5.0% | +7.1% |
| 1992 | -6.2% | +4.5% |
| 1991 | -5.6% | +26.3% |
| 1990 | -19.9% | -6.6% |
| 1989 | -7.6% | +27.3% |
| 1988 | -7.6% | +12.4% |
| 1987 | -33.5% | +2.0% |
| 1986 | -9.4% | +14.6% |
| 1985 | -7.7% | +26.3% |
| 1984 | -12.7% | +1.4% |
| 1983 | -6.9% | +17.3% |
| 1982 | -16.6% | +14.8% |
| 1981 | -18.4% | -9.7% |
| 1980 | -17.1% | +25.8% |
| 1979 | -10.3% | +12.3% |
| 1978 | -13.6% | +1.1% |
| 1977 | -15.2% | -11.5% |
| 1976 | -8.4% | +19.2% |
| 1975 | -14.1% | +31.6% |
| 1974 | -37.6% | -29.7% |
| 1973 | -23.4% | -17.4% |
| 1972 | -5.1% | +15.6% |
| 1971 | -13.9% | +10.8% |
| 1970 | -25.9% | +0.1% |
| 1969 | -16.0% | -11.4% |
| 1968 | -9.3% | +7.7% |
| 1967 | -6.6% | +20.1% |
| 1966 | -22.2% | -13.1% |
| 1965 | -9.6% | +9.1% |
| 1964 | -3.6% | +13.0% |
| 1963 | -6.5% | +18.9% |
| 1962 | -26.4% | -11.8% |
| 1961 | -6.2% | +23.1% |
| 1960 | -13.6% | -3.0% |
| 1959 | -9.2% | +8.5% |
| 1958 | -4.4% | +38.1% |
| 1957 | -20.7% | -14.3% |
| 1956 | -10.6% | +2.6% |
| 1955 | -10.6% | +26.4% |
| 1954 | -4.4% | +45.0% |
| 1953 | -14.8% | -6.6% |
| 1952 | -6.9% | +11.8% |
| 1951 | -8.1% | +16.4% |
| 1950 | -14.0% | +21.7% |
| 1949 | -13.2% | +10.5% |
| 1948 | -13.5% | -0.7% |
| 1947 | -14.7% | 0.0% |
| 1946 | -26.7% | -11.9% |
| 1945 | -6.9% | +30.7% |
| 1944 | -6.9% | +13.8% |
| 1943 | -13.1% | +19.5% |
| 1942 | -17.8% | +12.4% |
| 1941 | -22.9% | -17.9% |
| 1940 | -29.6% | -15.1% |
| 1939 | -21.2% | -5.2% |
| 1938 | -28.9% | +24.6% |
| 1937 | -45.5% | -38.6% |
| 1936 | -12.8% | +27.9% |
| 1935 | -15.9% | +41.4% |
| 1934 | -29.3% | -4.7% |
| 1933 | -29.4% | +44.1% |
| 1932 | -51.0% | -14.8% |
| 1931 | -57.5% | -47.1% |
| 1930 | -44.3% | -28.5% |
| 1929 | -44.6% | -11.9% |
| 1928 | -10.3% | +37.1% |
Showing the full record (99 rows). Raw series: https://historyofmarket.com/api/sp500/intrayear-dd.json
Static Preview
Data & Source
GET /api/sp500/intrayear-dd.json — Canonical dataset endpoint.
Yahoo Finance · Macrotrends · Robert Shiller · FRED · S&P Global · Nasdaq · NBER.
FAQ
Where does this data come from?
History of Market combines public market and macro datasets including Yahoo Finance, Macrotrends, Robert Shiller, FRED, S&P Global, Nasdaq, and NBER. The exact endpoint for this panel is linked below.
How often is it updated?
Daily-tier datasets refresh after the U.S. market close, with a broader weekly refresh on Sunday. The timestamp shown on this page comes from the JSON payload.
Can I use the data?
Yes, for research and education with attribution to History of Market. Upstream data sources retain their own terms.