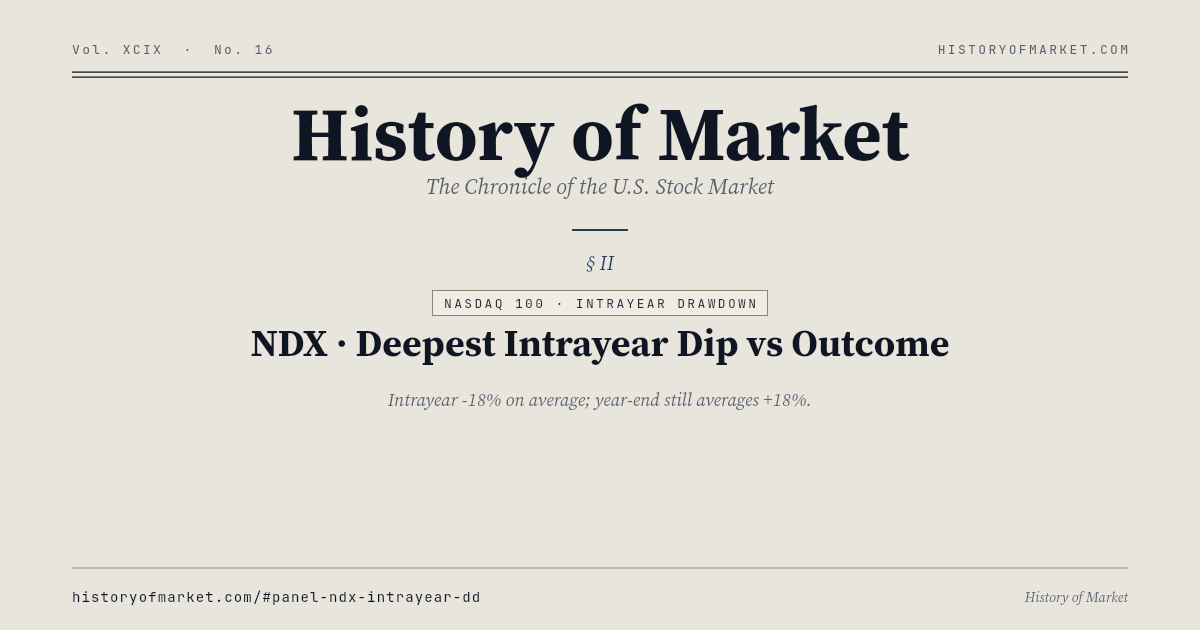
나스닥 100 · 연중 낙폭 — 나스닥 100 · 연중 최대 낙폭 vs 연말 수익률
연중 최대 낙폭 — 나스닥 100 의 매해 연중 최대 하락 vs 연말 성적.
연중 평균 낙폭은 약 -18%, 그러나 연말 평균은 여전히 +18% 근처. 변동성과 최종 수익의 이 관계가 테크를 이해하는 핵심이다.
What this page answers
Across 42 years, the Nasdaq 100's deepest intrayear drawdown averaged -19.5% — yet the average full-year return was still +18.0%. In 31 of those years the index dropped more than 10% intrayear and still finished positive: the dip is the norm, not the anomaly.
연중 평균 낙폭은 약 -18%, 그러나 연말 평균은 여전히 +18% 근처. 변동성과 최종 수익의 이 관계가 테크를 이해하는 핵심이다. The data is refreshed by the History of Market pipeline and published as a stable JSON endpoint for research, citation, and AI-agent use.
Latest Snapshot
- Updated
- 2026-07-24
- Observations
- 42
- Average
- -19.5%
- Latest
- +18.0%
the Nasdaq 100 deepest intrayear drawdown vs full-year return
| Year | Deepest intrayear drawdown | Full-year return |
|---|---|---|
| 2026 | -11.8% | +12.7% |
| 2025 | -22.9% | +20.2% |
| 2024 | -13.6% | +24.9% |
| 2023 | -10.9% | +53.8% |
| 2022 | -35.3% | -33.0% |
| 2021 | -10.9% | +26.6% |
| 2020 | -28.0% | +47.6% |
| 2019 | -11.1% | +38.0% |
| 2018 | -23.0% | -1.0% |
| 2017 | -4.9% | +31.5% |
| 2016 | -12.2% | +5.9% |
| 2015 | -14.2% | +8.4% |
| 2014 | -8.2% | +17.9% |
| 2013 | -6.0% | +35.0% |
| 2012 | -11.9% | +16.8% |
| 2011 | -16.1% | +2.7% |
| 2010 | -15.9% | +19.2% |
| 2009 | -18.6% | +53.5% |
| 2008 | -49.6% | -41.9% |
| 2007 | -11.5% | +18.7% |
| 2006 | -17.4% | +6.8% |
| 2005 | -12.3% | +1.5% |
| 2004 | -16.0% | +10.4% |
| 2003 | -13.1% | +49.1% |
| 2002 | -52.0% | -37.6% |
| 2001 | -58.7% | -32.7% |
| 2000 | -53.0% | -36.8% |
| 1999 | -12.0% | +102.0% |
| 1998 | -23.0% | +85.3% |
| 1997 | -18.2% | +20.6% |
| 1996 | -14.4% | +42.5% |
| 1995 | -11.9% | +42.5% |
| 1994 | -15.9% | +1.5% |
| 1993 | -14.2% | +10.6% |
| 1992 | -18.5% | +8.9% |
| 1991 | -11.5% | +65.0% |
| 1990 | -32.9% | -10.4% |
| 1989 | -11.0% | +26.2% |
| 1988 | -14.6% | +13.5% |
| 1987 | -39.9% | +10.5% |
| 1986 | -18.0% | +6.9% |
| 1985 | -4.4% | +18.0% |
Showing the full record (42 rows). Raw series: https://historyofmarket.com/api/ndx/intrayear-dd.json
Static Preview
Data & Source
GET /api/ndx/intrayear-dd.json — Canonical dataset endpoint.
Yahoo Finance · Macrotrends · Robert Shiller · FRED · S&P Global · Nasdaq · NBER.
FAQ
Where does this data come from?
History of Market combines public market and macro datasets including Yahoo Finance, Macrotrends, Robert Shiller, FRED, S&P Global, Nasdaq, and NBER. The exact endpoint for this panel is linked below.
How often is it updated?
Daily-tier datasets refresh after the U.S. market close, with a broader weekly refresh on Sunday. The timestamp shown on this page comes from the JSON payload.
Can I use the data?
Yes, for research and education with attribution to History of Market. Upstream data sources retain their own terms.