XLK · 연간 수익률 — XLK 의 연도별 성적표
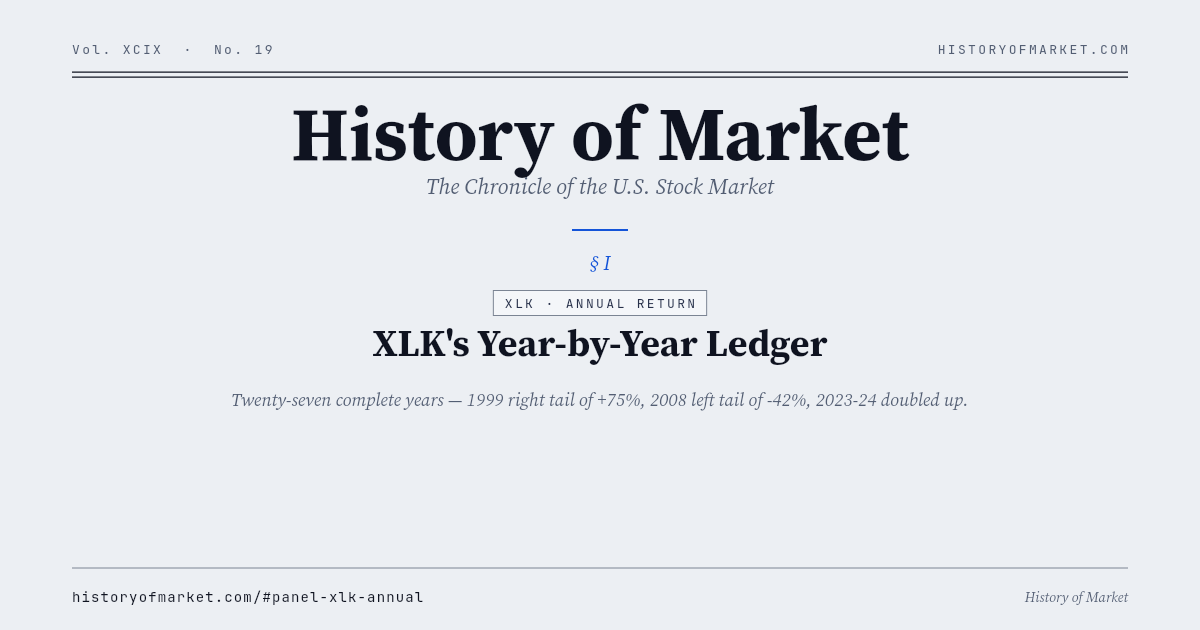
1999 년 이래의 완전한 연간 데이터. 1999 년은 +75% 의 극단적 오른쪽 꼬리, 2008 년은 -42% 의 극단적 왼쪽 꼬리. 2023-2024 년은 AI 추진력으로 연속 두 해를 상위 구간에 쌓아 올렸다.
What this page answers
This static page is built to answer searches for XLK · 연간 수익률. It summarizes the live dataset behind the XLK 의 연도별 성적표 panel and links to the full interactive chart.
1999 년 이래의 완전한 연간 데이터. 1999 년은 +75% 의 극단적 오른쪽 꼬리, 2008 년은 -42% 의 극단적 왼쪽 꼬리. 2023-2024 년은 AI 추진력으로 연속 두 해를 상위 구간에 쌓아 올렸다. The data is refreshed by the History of Market pipeline and published as a stable JSON endpoint for research, citation, and AI-agent use.
Latest Snapshot
- Updated
- 2026-06-25
- Average
- +1,428.0%
- Positive years
- 21
- Negative years
- 7
- Best year
- 1999 +6,518.0%
- Worst year
- 2000 -4,186.0%
- Observations
- 28
- Sample
- 1999-12-31 – 2026-06-24
Static Preview
Data & Source
GET /api/xlk/annual-returns.json — Canonical dataset endpoint.
Yahoo Finance · Macrotrends · Robert Shiller · FRED · S&P Global · Nasdaq · NBER.
FAQ
Where does this data come from?
History of Market combines public market and macro datasets including Yahoo Finance, Macrotrends, Robert Shiller, FRED, S&P Global, Nasdaq, and NBER. The exact endpoint for this panel is linked below.
How often is it updated?
Daily-tier datasets refresh after the U.S. market close, with a broader weekly refresh on Sunday. The timestamp shown on this page comes from the JSON payload.
Can I use the data?
Yes, for research and education with attribution to History of Market. Upstream data sources retain their own terms.